Build

Data and Analytics

Data platforms, pipelines and reporting that turn operational data into numbers your teams trust and use.

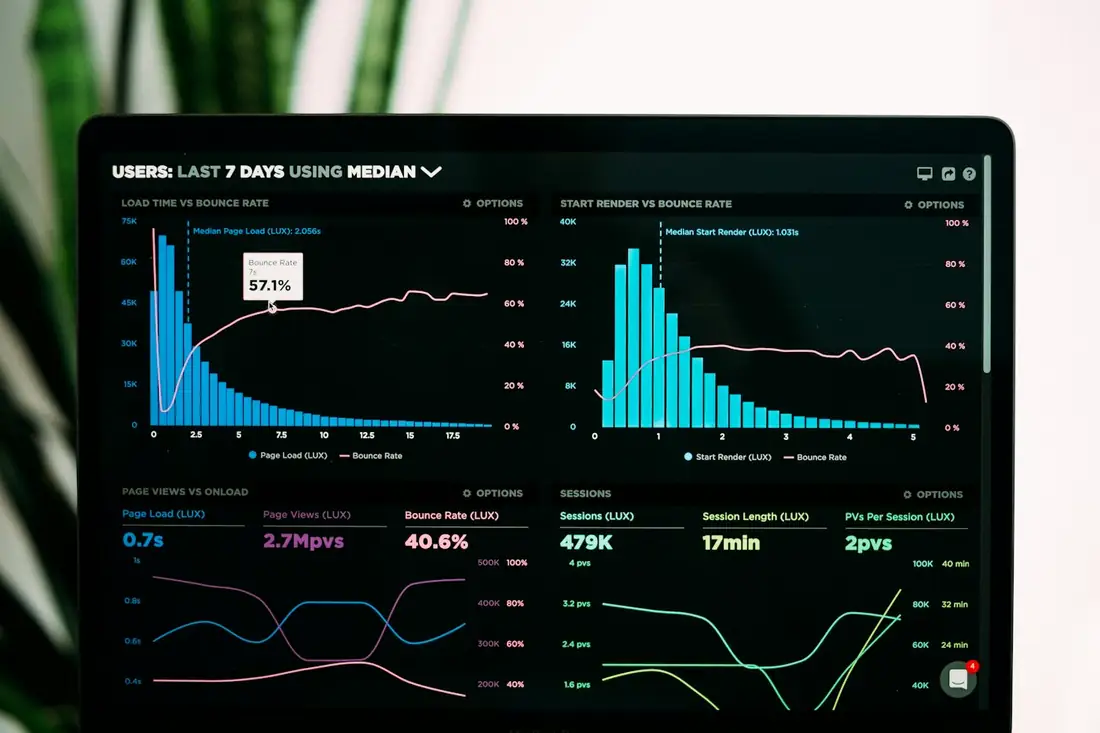
Charts on a laptop screen
First dashboards
6–10 weeks
Platforms
Snowflake, Databricks, Azure, AWS
BI tools
Power BI, Tableau, Looker
Approach
One subject area at a time

Overview

Data Platforms, Reporting and Dashboards People Trust.

Most companies have plenty of data and too few answers. The work is in bringing data together, cleaning it and presenting it so people can act on it.

We design data warehouses and lakehouses, build the pipelines that feed them and create dashboards for the questions your business asks every week.

You Might Need This If…

  • Different teams report different numbers for the same thing.
  • Monthly reporting takes days of spreadsheet work.
  • Data sits in many systems and nobody trusts the joins.
  • Old reports are slow, fragile and only one person can fix them.
  • You want to use AI but your data is not ready.

What we deliver

Data and Analytics Services

Take one piece or the whole scope, delivered by one team.

  • Data Engineering

    Pipelines that collect, clean and combine data from every source system.

  • Data Warehousing

    Warehouses and lakehouses on Snowflake, Databricks, Azure or AWS.

  • Business Intelligence

    Dashboards and self-service reporting in Power BI, Tableau or Looker.

  • Data Quality and Governance

    Definitions, ownership and checks so the numbers mean the same to everyone.

  • Reporting Migration

    Moving legacy reports to a modern platform without losing what users rely on.

  • Analytics Support

    Ongoing changes, new reports and platform administration.

What good looks like

The Outcomes We Work Towards

We agree how success will be measured before work starts, and report against it.

  • One version of the numbersAgreed definitions so finance, sales and operations report the same figures.
  • Reporting without the scrambleAutomated pipelines replace manual extracts and copy-paste.
  • Data ready for what is nextA clean, governed platform you can build analytics and AI on.

How we work

Four Phases, with Clear Deliverables

Each phase ends with something you can review and sign off, so you can stop, change course or continue with confidence.

  1. 12–3 weeks

    Ask the Questions

    Start from the decisions people need to make, not from the data.

    You get

    • Key questions and metrics
    • Source system map
    • Priority subject areas
  2. 22–3 weeks

    Model the Data

    Design a model that answers those questions consistently.

    You get

    • Data model
    • Metric definitions
    • Platform design
  3. 34–6 weeks per area

    Build Pipelines and Reports

    Deliver in increments, one subject area at a time.

    You get

    • Pipelines with tests
    • Dashboards
    • Data quality checks
  4. 4Ongoing

    Hand Over and Support

    Train your users and keep the platform running.

    You get

    • Training for report owners
    • Support and new requests
    • Platform administration

Technology

Tools and Platforms We Work With

We choose tools to fit your stack and your team, and we document what we build so you’re never locked in.

  • Snowflake
  • Databricks
  • Azure Synapse
  • AWS Redshift
  • Power BI
  • Tableau
  • dbt
  • SQL
  • Python

You see progress the whole way through, in the same kind of view shown here.

Examples

What This Work Looks Like

Two typical engagements: the problem, what we did, the team and the result.

Example scenario · Multi-site services group

One Set of Numbers for the Board

The situation

Finance and operations produced different revenue and margin figures from separate spreadsheets every month.

What we did

  • Agreed metric definitions with each department
  • Built pipelines from the ERP, CRM and billing systems into a cloud warehouse
  • Delivered a board pack and team dashboards in Power BI

Team
Data architect, 2 data engineers, BI developer, analyst
Timeline
4 months for the first three subject areas
Result
Month-end reporting now runs from one model that everyone uses.

Example scenario · Insurance company

Retiring a Legacy Reporting Server

The situation

Hundreds of old reports ran on an out-of-support server and many were no longer used.

What we did

  • Inventoried reports and usage, then retired the unused ones
  • Rebuilt the important reports on a modern BI tool
  • Trained report owners to maintain them
Team
BI lead, 2 BI developers, data engineer
Timeline
6 months
Result
Fewer, faster reports, with the old server switched off.

These examples show the kind of work we do. They are illustrative and do not describe a named client.

The Jebel Jais road in Ras Al Khaimah
United Arab Emirates edition

Data for UAE Teams

  • Arabic and English dashboards for leadership and operations.
  • Reporting for Central Bank and free-zone regulators.
  • Data residency and access controls for personal data under the PDPL.
  • A Dubai-based delivery lead on every project, with engineering in India, just 90 minutes behind Gulf time.

Team and pricing

Who You Work with, and How It’s Priced

Every engagement has a named delivery lead. Need individuals rather than a team? We place data engineers, BI developers, data analysts and more on contract, contract-to-hire or direct hire terms.

A Typical Team

Sized to the work; this is a common starting point.

  • Data architect1
  • Data engineers2–3
  • BI developer1–2
  • Data analyst1
  • Delivery lead1

Project

A fixed scope and timeline, led by our delivery lead. Often fixed price for discovery and first release.

Dedicated Team

A stable team working on your backlog and tools, billed monthly. Scale up or down with notice.

Managed Service

We run and improve what has been built, against agreed service levels, for a monthly fee.

Hire data engineers instead

FAQs

Questions We Often Hear

Do we need a data warehouse or a lakehouse?

Most companies need a well-modelled warehouse first. A lakehouse helps when you have large volumes of semi-structured data or data science workloads.

Which BI tool should we use?

Usually the one your company already licenses. We build in Power BI, Tableau and Looker and can migrate between them.

How do you make sure the numbers are right?

Automated tests on every pipeline, reconciliation with source systems, and metric definitions signed off by the business.

How quickly will we see something?

The first subject area, with dashboards, usually lands in six to ten weeks.

Can you support the platform afterwards?

Yes. We offer monthly support for pipelines, new reports and platform administration.

Next step

Talk to Us About Data and Analytics

Tell us what you need and when. We’ll come back with an approach, a team and a plan.

  1. We reply within one working day.
  2. A short call with someone who knows the subject, not a salesperson reading a script.
  3. A written proposal or shortlist, usually within a week.

Prefer email? Write to info@tekishub.com.